
from sktime.datasets import load_airline
from sktime.forecasting.arima import AutoARIMA
from sktime.forecasting.model_evaluation import evaluate
from sktime.forecasting.model_selection import ExpandingWindowSplitter
from sktime.forecasting.model_selection import SlidingWindowSplitter
from sktime.utils.plotting import plot_series
# load data
y = load_airline()

# create a forecaster
forecaster = AutoARIMA(sp=12, suppress_warnings=True)

# define cross validation parameters
# step_length, growing step of training data size
# fh, forecasting horizon
#     fh represent the distance to the end of training data
#     training data, 1949.01 to 1954.12
#     [1, 3, 5, 7], represent 1955.01, 1955.03, 1955.05, 1955.07
# initial_window, initial training data windows
cv = ExpandingWindowSplitter(step_length=12, fh=[1, 3, 5, 7], initial_window=72)

# implement cross validation
df = evaluate(forecaster=forecaster, y=y, cv=cv, strategy="refit", return_data=True)

df['test_MeanAbsolutePercentageError'].mean()
0.04592431316985412
df
| test_MeanAbsolutePercentageError | fit_time | pred_time | len_train_window | cutoff | y_train | y_test | y_pred | |
|---|---|---|---|---|---|---|---|---|
| 0 | 0.046795 | 2.511999 | 0.006742 | 72 | 1954-12 | Period 1949-01 112.0 1949-02 118.0 1949-... | Period 1955-01 242.0 1955-03 267.0 1955-... | 1955-01 232.146575 1955-03 267.401294 19... |
| 1 | 0.046369 | 3.020546 | 0.005270 | 84 | 1955-12 | Period 1949-01 112.0 1949-02 118.0 1949-... | Period 1956-01 284.0 1956-03 317.0 1956-... | 1956-01 282.568762 1956-03 302.619870 19... |
| 2 | 0.026692 | 4.549398 | 0.004204 | 96 | 1956-12 | Period 1949-01 112.0 1949-02 118.0 1949-... | Period 1957-01 315.0 1957-03 356.0 1957-... | 1957-01 314.174145 1957-03 345.253673 19... |
| 3 | 0.039624 | 2.149422 | 0.005393 | 108 | 1957-12 | Period 1949-01 112.0 1949-02 118.0 1949-... | Period 1958-01 340.0 1958-03 362.0 1958-... | 1958-01 345.964471 1958-03 386.787992 19... |
| 4 | 0.073457 | 2.956735 | 0.005959 | 120 | 1958-12 | Period 1949-01 112.0 1949-02 118.0 1949-... | Period 1959-01 360.0 1959-03 406.0 1959-... | 1959-01 345.739350 1959-03 372.828949 19... |
| 5 | 0.042609 | 6.139920 | 0.005772 | 132 | 1959-12 | Period 1949-01 112.0 1949-02 118.0 1949-... | Period 1960-01 417.0 1960-03 419.0 1960-... | 1960-01 419.967172 1960-03 457.994381 19... |
plot_series(df['y_train'][1], df['y_test'][1], df['y_pred'][1], labels=["y_train", "y_test", "y_pred"])
(<Figure size 1600x400 with 1 Axes>,
 <Axes: ylabel='Number of airline passengers'>)

# load data
y = load_airline()
# create a forecaster
forecaster = AutoARIMA(sp=12, suppress_warnings=True)
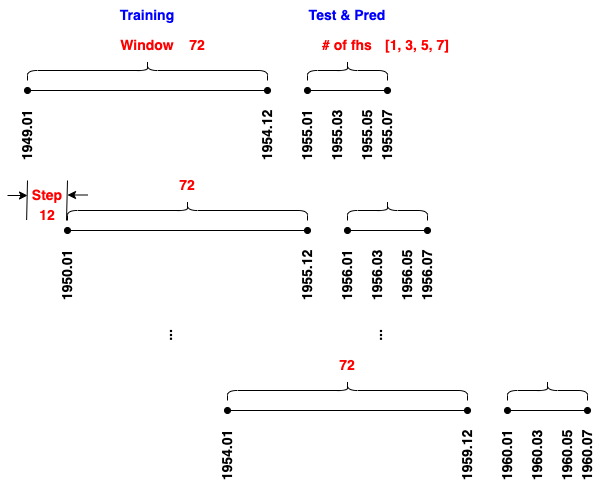
# define cross validation parameters
# step_length, growing step of training data size
# fh, forecasting horizon
# fh represent the distance to the end of training data
# training data, 1949.01 to 1954.12
# [1, 3, 5, 7], represent 1955.01, 1955.03, 1955.05, 1955.07
# initial_window, initial training data windows
cv = SlidingWindowSplitter(step_length=12, fh=[1, 3, 5, 7], window_length=72)
# implement cross validation
df = evaluate(forecaster=forecaster, y=y, cv=cv, strategy="refit", return_data=True)
df['test_MeanAbsolutePercentageError'].mean()
0.05076923937663073
df
| test_MeanAbsolutePercentageError | fit_time | pred_time | len_train_window | cutoff | y_train | y_test | y_pred | |
|---|---|---|---|---|---|---|---|---|
| 0 | 0.046795 | 2.478890 | 0.005060 | 72 | 1954-12 | Period 1949-01 112.0 1949-02 118.0 1949-... | Period 1955-01 242.0 1955-03 267.0 1955-... | 1955-01 232.146575 1955-03 267.401294 19... |
| 1 | 0.043258 | 2.542394 | 0.005163 | 72 | 1955-12 | 1950-01 115.0 1950-02 126.0 1950-03 1... | 1956-01 284.0 1956-03 317.0 1956-05 3... | 1956-01 282.583134 1956-03 303.210321 19... |
| 2 | 0.029347 | 1.015556 | 0.004076 | 72 | 1956-12 | Period 1951-01 145.0 1951-02 150.0 1951-... | Period 1957-01 315.0 1957-03 356.0 1957-... | 1957-01 312.0 1957-03 345.0 1957-05 3... |
| 3 | 0.037439 | 1.116795 | 0.004227 | 72 | 1957-12 | Period 1952-01 171.0 1952-02 180.0 1952-... | Period 1958-01 340.0 1958-03 362.0 1958-... | 1958-01 345.0 1958-03 386.0 1958-05 3... |
| 4 | 0.106939 | 6.440724 | 0.003960 | 72 | 1958-12 | Period 1953-01 196.0 1953-02 196.0 1953-... | Period 1959-01 360.0 1959-03 406.0 1959-... | 1959-01 340.315698 1959-03 354.387886 19... |
| 5 | 0.040837 | 1.720588 | 0.005030 | 72 | 1959-12 | Period 1954-01 204.0 1954-02 188.0 1954-... | Period 1960-01 417.0 1960-03 419.0 1960-... | 1960-01 421.971103 1960-03 459.472694 19... |
plot_series(df['y_train'][1], df['y_test'][1], df['y_pred'][1], labels=["y_train", "y_test", "y_pred"])
(<Figure size 1600x400 with 1 Axes>,
 <Axes: ylabel='Number of airline passengers'>)
