Callback
All of the callbacks in a Dash app are executed with the initial value of their inputs when the app is first loaded. This is known as the "initial call" of the callback
- when app.config['suppress_callback_exceptions'] = False, dash validates all callbacks when the application is launched and throws a NonExistantIdException if a component does not exist in the initial state
A callback is executed when all of the callback's inputs have reached their final values
- If any input is not ready, will wait until all of them are readly
Each callback function can have multiple outputs
Callback must have Output(s) and Input(s)
Callback accepts the properties of an objects, instead of the object itself
Multiple Inputs Callback
# assets/style.css
body {
    font-family: "Lato", sans-serif;
    margin: 0;
    background-color: #F7F7F7;
}

.header {
    background-color: #222222;
    height: 288px;
    padding: 16px 0 0 0;
}

.header-emoji {
    font-size: 48px;
    margin: 0 auto;
    text-align: center;
}

.header-title {
    color: #FFFFFF;
    font-size: 48px;
    font-weight: bold;
    text-align: center;
    margin: 0 auto;
}

.header-description {
    color: #CFCFCF;
    margin: 4px auto;
    text-align: center;
    max-width: 384px;
}

.wrapper {
    margin-right: auto;
    margin-left: auto;
    max-width: 1024px;
    padding-right: 10px;
    padding-left: 10px;
    margin-top: 32px;
}

.card {
    margin-bottom: 24px;
    box-shadow: 0 4px 6px 0 rgba(0, 0, 0, 0.18);
}

.menu {
    height: 112px;
    width: 912px;
    display: flex;
    justify-content: space-evenly;
    padding-top: 24px;
    margin: -80px auto 0 auto;
    background-color: #FFFFFF;
    box-shadow: 0 4px 6px 0 rgba(0, 0, 0, 0.18);
}

.Select-control {
    width: 256px;
    height: 48px;
}

.Select--single > .Select-control .Select-value, .Select-placeholder {
    line-height: 48px;
}

.Select--multi .Select-value-label {
    line-height: 32px;
}

.menu-title {
    margin-bottom: 6px;
    font-weight: bold;
    color: #079A82;
}
import dash
import dash_core_components as dcc
import dash_html_components as html
from dash.dependencies import Input, Output
import pandas as pd
import numpy as np

data = pd.read_csv("avocado.csv")
#data = data.query("type == 'conventional' and region == 'Albany'")
data["Date"] = pd.to_datetime(data["Date"], format="%Y-%m-%d")
data.sort_values("Date", inplace=True)

app = dash.Dash(__name__)

app.layout = html.Div(
        children = [html.Div(
            children = [html.H1(children="Avocado Analytics",
            className="header-title",
    )]
            ),

            html.Div(
            children=[
                html.Div(children="Region", className="menu-title"),
                dcc.Dropdown(
                    id="region-filter",
                    options=[
                        {"label": region, "value": region}
                        for region in np.sort(data.region.unique())
                    ],
                    value="Albany",
                    clearable=False,
                    className="dropdown",
                ),
            ]
        ),
        html.Div(
            children=[
                html.Div(children="Type", className="menu-title"),
                dcc.Dropdown(
                    id="type-filter",
                    options=[
                        {"label": avocado_type, "value": avocado_type}
                        for avocado_type in data.type.unique()
                    ],
                    value="organic",
                    clearable=False,
                    searchable=False,
                    className="dropdown",
                ),
            ],
        ),

            html.Div(
        children = dcc.Graph(
            id="volume-chart", config={"displayModeBar": False},
        ),
        className="card"
        )
    ]
)

@app.callback(
    Output("volume-chart", "figure"),
    [
        Input("region-filter", "value"),
        Input("type-filter", "value"),
    ],
)
def update_plot(region, type):
    mask = (
        (data.region == region)
        & (data.type == type))
    filtered_data = data.loc[mask, :]

    volume_chart_figure = {
        "data": [
            {
                "x": filtered_data["Date"],
                "y": filtered_data["Total Volume"],
                "type": "lines",
            },
        ],
        "layout": {
            "title": {
                "text": "Avocados Sold",
                "x": 0.05,
                "xanchor": "left"
            },
            "xaxis": {"fixedrange": True},
            "yaxis": {"fixedrange": True},
            "colorway": ["#E12D39"],
        },
    }

    return volume_chart_figure

if __name__ == "__main__":
    app.run_server(debug=True)
Multiple Outputs Callback
import dash
import dash_core_components as dcc
import dash_html_components as html
from dash.dependencies import Input, Output

external_stylesheets = ['https://codepen.io/chriddyp/pen/bWLwgP.css']

app = dash.Dash(__name__, external_stylesheets=external_stylesheets)

app.layout = html.Div([
    html.Label('Label 1', id='id_1'),
    html.Label('Label 2', id='id_2'),
    dcc.Input(id='input'),
])

@app.callback(
    [Output(component_id='id_1', component_property='children'),
        Output(component_id='id_2', component_property='children')],
    Input(component_id='input', component_property='value')
)
def update_outputs(input_value):
    if input_value:
        return 'Label 1: '+input_value, 'Label 2: '+input_value
    else:
        return 'Label 1:', 'Label 2'

if __name__ == '__main__':
    app.run_server(debug=True)
Chained Callbacks
import dash
import dash_core_components as dcc
import dash_html_components as html
from dash.dependencies import Input, Output

external_stylesheets = ['https://codepen.io/chriddyp/pen/bWLwgP.css']

app = dash.Dash(__name__, external_stylesheets=external_stylesheets)

app.layout = html.Div([
    html.Label('Label 1', id='id_1'),
    html.Label('Label 2', id='id_2'),
    dcc.Input(id='input'),
])

@app.callback(
    Output(component_id='id_1', component_property='children'),
    Input(component_id='input', component_property='value')
)
def update_input_label1(input_value):
    if input_value:
        return 'Label 1: '+input_value

@app.callback(
    Output(component_id='id_2', component_property='children'),
    Input(component_id='id_1', component_property='children')
)
def update_label1_label2(input_value):
    if input_value:
        return 'Label 2: '+input_value

if __name__ == '__main__':
    app.run_server(debug=True)
State
Input, components response right away
State, do not response until the user finish entering all of information in the form
import dash
import dash_core_components as dcc
import dash_html_components as html
from dash.dependencies import Input, Output, State

external_stylesheets = ['https://codepen.io/chriddyp/pen/bWLwgP.css']

app = dash.Dash(__name__, external_stylesheets=external_stylesheets)

app.layout = html.Div([
    dcc.Input(id='input-state', type='text', value='input'),
    html.Button(id='submit-button-state', n_clicks=0, children='Submit'),
    html.Div(id='output-state')
])


@app.callback(Output('output-state', 'children'),
              Input('submit-button-state', 'n_clicks'),
              State('input-state', 'value')
              )
def update_output(n_clicks, input):
    return u'''
        The Button has been pressed {} times,
        Input is "{}",
    '''.format(n_clicks, input)


if __name__ == '__main__':
    app.run_server(debug=True)
PreventUpdate
Do not update the callback output
import dash
import dash_html_components as html
from dash.dependencies import Input, Output
from dash.exceptions import PreventUpdate

external_stylesheets = ['https://codepen.io/chriddyp/pen/bWLwgP.css']

app = dash.Dash(__name__, external_stylesheets=external_stylesheets)

app.layout = html.Div([
    html.Button('Click here to see the content', id='show-secret'),
    html.Div(id='body-div')
])

# suppress exception when a component does not exist in the initial state
app.config['suppress_callback_exceptions'] = True

@app.callback(
    Output(component_id='body-div', component_property='children'),
    Input(component_id='show-secret', component_property='n_clicks')
)
def update_output(n_clicks):
    if n_clicks is None:
        raise PreventUpdate # do not update the callback output
    else:
        return html.Label(id='label')

@app.callback(
    Output(component_id='label', component_property='children'),
    Input(component_id='show-secret', component_property='n_clicks')
)
def update_label(n_clicks):
    return 'Clicks: '+str(n_clicks)

if __name__ == '__main__':
    app.run_server(debug=True)
dash.callback_context
A global variable, available only inside a callback
Use to Determine which Input has fired
import json

import dash
import dash_html_components as html
import dash_core_components as dcc
from dash.dependencies import Input, Output

app = dash.Dash(__name__)

app.layout = html.Div([
    dcc.Input(id='input1'),
    dcc.Input(id='input2'),
    html.Div(id='container')
])


@app.callback(Output('container', 'children'),
              [Input('input1', 'value'),
              Input('input2', 'value')]
              )
def display(click1, click2):
    ctx = dash.callback_context

    if not ctx.triggered:
        button_id = 'No clicks yet'
    else:
        button_id = ctx.triggered[0]['prop_id'].split('.')[0]

    ctx_msg = json.dumps({
        'states': ctx.states,
        'triggered': ctx.triggered,
        'inputs': ctx.inputs
    }, indent=2)

    return html.Pre(ctx_msg)

if __name__ == '__main__':
    app.run_server(debug=True)
Sharing Data Between Callbacks
Use global variable
- Dash apps run across multiple workers, their memory is not shared
- Global variabls are shared by multiple workers
- If modify a global variable by one workers, the changes are applied to the rest of the workers
- Cause network transport cost
import os
import dash
import pandas as pd

from dash.dependencies import Output, Input
from dash.exceptions import PreventUpdate

import dash_html_components as html
import dash_core_components as dcc
import dash_table
import plotly.graph_objects as go
from dash.exceptions import PreventUpdate

app = dash.Dash(__name__)

df = None

def get_files():
    container = []
    for root, dirs, files in os.walk("./"):
        for file in files:
            if file.endswith(".csv"):
                container.append(file)

    return [{'label': file, 'value': file} for file in container]

def get_fields(data):
    fields = []
    for item in data.columns:
        t = data[item].dtype
        if t == 'int' or t =='float':
            fields.append(item)
    return [{'label': field, 'value': field} for field in fields]

app.layout = html.Div([
    #dcc.Store(id='output'),
    dcc.Dropdown(id='field1', options=get_files()),
    html.Div(id='content'),
])

@app.callback(Output('content', 'children'),
              Input('field1', 'value'))
def update_fields(value):
    if not value:
        raise PreventUpdate

    print(value)

    global df
    df = pd.read_csv(value)
    print(df)

    graph = dcc.Graph(id='graph')

    fields = get_fields(df)

    dropdown = dcc.Dropdown(id='field2', options=get_fields(df), multi=True)

    return [dropdown, graph]

@app.callback(Output('graph', 'figure'),
              Input('field2', 'value'))
def update_fields2(value):
    if not value:
        raise PreventUpdate
    if len(value) < 2:
        raise PreventUpdate

    fig = go.Figure()
    for i in range(1, len(value)):
        fig.add_trace(go.Scatter(x=df[value[0]], y=df[value[i]], mode='markers', name=value[i]))
    return fig

if __name__ == '__main__':
    app.run_server(debug=True, threaded=True, port=10450)
Three places to save data
- In the user's browser session
- On the disk
- In a shared memory space like with Redis
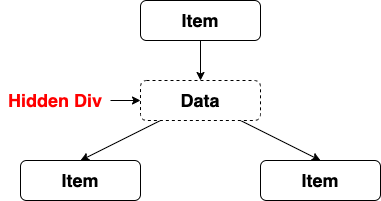
Saving the data as part of Dash's front-end store
- Data that is cached in this way will only be available in the user's current session
- There could be a cost in network transport. If you're sharing 10MB of data between callbacks, then that data will be transported over the network between each callback
import dash
import dash_core_components as dcc
import dash_html_components as html
import numpy as np
import pandas as pd
from dash.dependencies import Input, Output
from dash.exceptions import PreventUpdate
import plotly.express as px

external_stylesheets = ['https://codepen.io/chriddyp/pen/bWLwgP.css']

app = dash.Dash(__name__, external_stylesheets=external_stylesheets)

app.layout = html.Div([
    html.Div(id='display-1'),
    html.Div(id='display-2'),
    dcc.Dropdown(id='dropdown',
        options=[
            {'label': 'A', 'value': 'A'},
            {'label': 'B', 'value': 'B'}
            ]),

    # Hidden div inside the app that stores the intermediate value
    html.Div(id='intermediate-value', style={'display': 'none'})
])

@app.callback(Output('intermediate-value', 'children'), Input('dropdown', 'value'))
def clean_data(value):
    if not value:
        raise PreventUpdate
    cleaned_df = pd.read_csv('solar.csv')

    # more generally, this line would be
    # json.dumps(cleaned_df)
    print('Output intermediate value ...')
    return cleaned_df.to_json(date_format='iso', orient='split')

@app.callback(Output('display-1', 'children'),
              Input('intermediate-value', 'children'))
def update_output_1(value):
    dff = pd.read_json(value, orient='split')
    return str(dff)

@app.callback(Output('display-2', 'children'),
              Input('intermediate-value', 'children'))
def update_output_1(value):
    dff = pd.read_json(value, orient='split')
    return str(dff)

if __name__ == '__main__':
    app.run_server(debug=True)
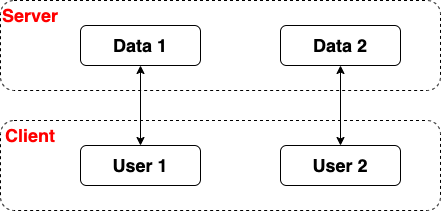
Save the data on the filesystem cache with a session ID and then reference the data using that session ID
Because data is saved on the server instead of transported over the network, this method is generally faster than the "hidden div" method
Note that filesystem cache doesn't work on systems with ephemeral filesystems like Heroku
import dash
from dash.dependencies import Input, Output
import dash_core_components as dcc
import dash_html_components as html
import datetime
from flask_caching import Cache
import os
import pandas as pd
import time
import uuid

external_stylesheets = [
    # Dash CSS
    'https://codepen.io/chriddyp/pen/bWLwgP.css',
    # Loading screen CSS
    'https://codepen.io/chriddyp/pen/brPBPO.css']

app = dash.Dash(__name__, external_stylesheets=external_stylesheets)
cache = Cache(app.server, config={
    'CACHE_TYPE': 'redis',
    # Note that filesystem cache doesn't work on systems with ephemeral
    # filesystems like Heroku.
    'CACHE_TYPE': 'filesystem',
    'CACHE_DIR': 'cache-directory',

    # should be equal to maximum number of users on the app at a single time
    # higher numbers will store more data in the filesystem / redis cache
    'CACHE_THRESHOLD': 200
})


def get_dataframe(session_id):
    @cache.memoize()
    def query_and_serialize_data(session_id):
        # expensive or user/session-unique data processing step goes here

        # simulate a user/session-unique data processing step by generating
        # data that is dependent on time
        now = datetime.datetime.now()

        # simulate an expensive data processing task by sleeping
        time.sleep(5)

        df = pd.DataFrame({
            'time': [
                str(now - datetime.timedelta(seconds=15)),
                str(now - datetime.timedelta(seconds=10)),
                str(now - datetime.timedelta(seconds=5)),
                str(now)
            ],
            'values': ['a', 'b', 'a', 'c']
        })
        return df.to_json()

    return pd.read_json(query_and_serialize_data(session_id))


def serve_layout():
    session_id = str(uuid.uuid4())

    return html.Div([
        html.Div(session_id, id='session-id', style={}),
        html.Button('Get data', id='get-data-button'),
        html.Div(id='output-1'),
        html.Div(id='output-2')
    ])


app.layout = serve_layout


@app.callback(Output('output-1', 'children'),
              Input('get-data-button', 'n_clicks'),
              Input('session-id', 'children'))
def display_value_1(value, session_id):
    df = get_dataframe(session_id)
    return html.Div([
        'Output 1 - Button has been clicked {} times'.format(value),
        html.Pre(df.to_csv())
    ])


@app.callback(Output('output-2', 'children'),
              Input('get-data-button', 'n_clicks'),
              Input('session-id', 'children'))
def display_value_2(value, session_id):
    df = get_dataframe(session_id)
    return html.Div([
        'Output 2 - Button has been clicked {} times'.format(value),
        html.Pre(df.to_csv())
    ])


if __name__ == '__main__':
    app.run_server(debug=True)

Use Store
- Store JSON data in the browser
- User sessions accessing the same app are independent
- Support dict | list | number | string | boolean
- It's generally safe to store up to 2MB in most environments, and 5~10MB in most desktop-only applications
import os
import dash
import pandas as pd

from dash.dependencies import Output, Input, State
from dash.exceptions import PreventUpdate

import dash_html_components as html
import dash_core_components as dcc
import dash_table
import plotly.graph_objects as go
from dash.exceptions import PreventUpdate

app = dash.Dash(__name__)

def get_files():
    container = []
    for root, dirs, files in os.walk("./"):
        for file in files:
            if file.endswith(".csv"):
                container.append(file)

    return [{'label': file, 'value': file} for file in container]

def get_fields(data):
    fields = []
    for item in data.columns:
        t = data[item].dtype
        if t == 'int' or t =='float':
            fields.append(item)
    return [{'label': field, 'value': field} for field in fields]

app.layout = html.Div([
    dcc.Store(id='memory'),
    dcc.Dropdown(id='field1', options=get_files()),
    html.Div(id='content'),
])

@app.callback(Output('memory', 'data'),
              Input('field1', 'value'))
def update_store(value):
    if not value:
        raise PreventUpdate

    df = pd.read_csv(value)
    return df.to_dict('records')

@app.callback(Output('content', 'children'),
              Input('memory', 'modified_timestamp'),
              State('memory', 'data'))
def update_fields(ts, data):
    if ts is None:
        raise PreventUpdate

    df = pd.DataFrame.from_dict(data)
    graph = dcc.Graph(id='graph')

    fields = get_fields(df)

    dropdown = dcc.Dropdown(id='field2', options=get_fields(df), multi=True)

    return dropdown, graph

@app.callback(Output('graph', 'figure'),
              Input('field2', 'value'),
              State('memory', 'data'))
def update_fields2(value, data):
    if not value:
        raise PreventUpdate
    if len(value) < 2:
        raise PreventUpdate

    df = pd.DataFrame.from_dict(data)

    fig = go.Figure()
    for i in range(1, len(value)):
        fig.add_trace(go.Scatter(x=df[value[0]], y=df[value[i]], mode='markers', name=value[i]))
    return fig

if __name__ == '__main__':
    app.run_server(debug=True, threaded=True, port=10450)
Reference
