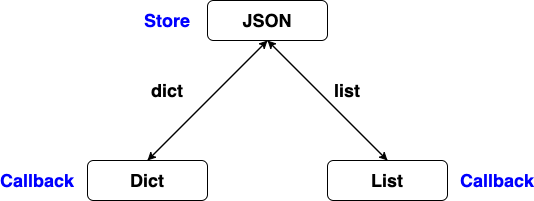
Store
Store dash components, strings, dictionaries, numbers, None,
or lists of those

Store Type
memory
- default
- the memory store reverts to the default on every page refresh
local
- Share data between multiple pages in a browser, and keep it until it is cleared
- Restarting the browser does not lose data
- Different browsers keep differnt copies
session
- Keep data in a single page
- Not share data with other pages
- Refreshing page does not lose data
- Closing page will lose data
import dash
from dash import dcc
from dash import html
from dash.dependencies import Input, Output, State
from dash.exceptions import PreventUpdate
from os import path

external_stylesheets = ['https://codepen.io/chriddyp/pen/bWLwgP.css']

app = dash.Dash(__name__, external_stylesheets=external_stylesheets)
server = app.server

app.layout = html.Div([
        dcc.Input(id = 'input'),
        html.H1(id = 'content'),
        dcc.Store(id='cache') # default, memory
        #dcc.Store(id='cache', storage_type='local') # local
        #dcc.Store(id='cache', storage_type='session') # session
    ], className='container')

@app.callback(
    Output('cache', 'data'),
    Input('input', 'value'),
)
def update_output_1(value):
    if not value:
        raise PreventUpdate
    print(value)
    return value

@app.callback(
    Output('content', 'children'),
    Input('cache', 'data'),
)
def update_output_2(data):
    return data

if __name__ == '__main__':
    app.run_server(debug=True)
Share Data between Callbacks
import collections
import dash
import pandas as pd

from dash.dependencies import Output, Input
from dash.exceptions import PreventUpdate

from dash import html
from dash import dcc
from dash import dash_table
import plotly.graph_objects as go

app = dash.Dash(__name__)

df = pd.read_csv('https://raw.githubusercontent.com/plotly/datasets/master/gapminderDataFiveYear.csv')

countries = set(df['country'])

app.layout = html.Div([
    dcc.Store(id='memory-output'),
    dcc.Dropdown(id='memory-countries', options=[
        {'value': x, 'label': x} for x in countries
    ], multi=True, value=['Canada', 'United States']),
    dcc.Dropdown(id='memory-field', options=[
        {'value': 'lifeExp', 'label': 'Life expectancy'},
        {'value': 'gdpPercap', 'label': 'GDP per capita'},
    ], value='lifeExp'),
    html.Div([
        dcc.Graph(id='memory-graph'),
        dash_table.DataTable(
            id='memory-table',
            columns=[{'name': i, 'id': i} for i in df.columns]
        ),
    ])
])


@app.callback(Output('memory-output', 'data'),
              Input('memory-countries', 'value'))
def filter_countries(countries_selected):
    if not countries_selected:
        # Return all the rows on initial load/no country selected.
        return df.to_dict('records')

    filtered = df.query('country in @countries_selected')

    return filtered.to_dict('records')


@app.callback(Output('memory-table', 'data'),
              Input('memory-output', 'data'))
def on_data_set_table(data):
    if data is None:
        raise PreventUpdate

    return data


@app.callback(Output('memory-graph', 'figure'),
              Input('memory-output', 'data'),
              Input('memory-field', 'value'))
def on_data_set_graph(data, field):
    if data is None:
        raise PreventUpdate

    temp = pd.DataFrame.from_dict(data)
    countries = set(temp['country'].unique())

    fig = go.Figure()
    for country in countries:
        country_data = temp[temp['country'] == country]
        fig.add_trace(go.Scatter(x=country_data['year'], y=country_data[field], name=country))

    return fig

if __name__ == '__main__':
    app.run_server(debug=True, threaded=True, port=10450)
Share Multiple Data between Callbacks
import collections
import dash
import pandas as pd

from dash.dependencies import Output, Input
from dash.exceptions import PreventUpdate

from dash import html
from dash import dcc
from dash import dash_table
import plotly.graph_objects as go

app = dash.Dash(__name__)

df = pd.read_csv('https://raw.githubusercontent.com/plotly/datasets/master/gapminderDataFiveYear.csv')

countries = set(df['country'])

app.layout = html.Div([
    dcc.Store(id='memory-output'),
    dcc.Dropdown(id='memory-countries', options=[
        {'value': x, 'label': x} for x in countries
    ], multi=True, value=['Canada', 'United States']),
    dcc.Dropdown(id='memory-field', options=[
        {'value': 'lifeExp', 'label': 'Life expectancy'},
        {'value': 'gdpPercap', 'label': 'GDP per capita'},
    ], value='lifeExp'),
    html.Div([
        dcc.Graph(id='memory-graph'),
        dash_table.DataTable(
            id='memory-table',
            columns=[{'name': i, 'id': i} for i in df.columns]
        ),
    ])
])


@app.callback(Output('memory-output', 'data'),
              Input('memory-countries', 'value'))
def filter_countries(countries_selected):
    if not countries_selected:
        # Return all the rows on initial load/no country selected.
        return df.to_dict('records')

    filtered = df.query('country in @countries_selected')

    return {'data': filtered.to_dict('records'), 'load': True}


@app.callback(Output('memory-table', 'data'),
              Input('memory-output', 'data'))
def on_data_set_table(data):
    if data is None:
        raise PreventUpdate

    return data['data']


@app.callback(Output('memory-graph', 'figure'),
              Input('memory-output', 'data'),
              Input('memory-field', 'value'))
def on_data_set_graph(data, field):
    if data is None:
        raise PreventUpdate

    print(data['load'])
    temp = pd.DataFrame.from_dict(data['data'])
    countries = set(temp['country'].unique())

    fig = go.Figure()
    for country in countries:
        country_data = temp[temp['country'] == country]
        fig.add_trace(go.Scatter(x=country_data['year'], y=country_data[field], name=country))

    return fig

if __name__ == '__main__':
    app.run_server(debug=True, threaded=True, port=10450)
Reference

